
This is part of what prescriptive maintenance might be. A buzz word that has been around for about a year now. In this post, we will show you how to use condition data to "customize" the ISO-10816-7 standard for your application.
We will present you a fascinating topic, centrifugal pumps. What is so special about this type of equipment? There are many of them currently installed globally, and the European Association of Pump Manufacturers (Europump) estimates that pumps consume around 20% of the world's electric energy. In some specific applications, the consumption can reach from 25 - 50%. That is a huge amount of energy. If you are in the line of sustainability, you know that something has to be done to reduce this, or at least, to keep it within acceptable limits. Pumps can not be left in the hands of poor operation strategies, which would definitively cause an insane energy consumption even over that 20% mentioned initially.
In one of our previous articles, we described how a user saved money by reducing energy consumption alone in a set of three centrifugal pumps. We used data to generate insights, which led to actions. Centrifugal pumps are sometimes overlooked from the efficiency monitoring standpoint. As long as they provide the flowrate we need, we often don't pay attention to how much money we are spending to move one cubic meter of water, as an example. This is just one part of the story. Let's explore the other side.
Not only tracking the efficiency of the pump is key to maintain the function of these assets. We have to look at the mechanical condition. In this case, we will focus on the vibration levels of centrifugal pumps and their relation to the pump's duty point, that is, where the pump operates in the curve formed by the dynamic head vs. flowrate.
We will show you how to use data collected from your pumping system to tailor the standard ISO-10816-7 to your specific conditions. You could ask: But isn't the standard ready for use? Why should I modify it?
To answer this, let's narrow the focus of the topic more. The ISO-10816-7 mentions two operation regions: the allowable operation region (AOR) and the preferred operating region (POR). It is known that a pump running outside of the AOR will be subjected to higher vibration values caused by high dynamic forces. If these high forces are allowed for extended periods of operation, damage or premature wear could occur. Keeping track of the pump's operation regions is definitively important. Let's bring a figure of the AOL and POR according to ISO-10816-7

According to the standard, in general, the POR is located between 70% and 120% of the BEP (this is a generalization). Apparently, there is no specific percentage definition of the AOR. Some manufactures define the AOR in a window marked by the minimum flow condition up to the halfway between the end of the POR and the end of the head vs. flowrate curve. These are general recommendations not only aimed as a pump selection guideline but also for pump operation guidelines.
When selecting a pump, you don't have an idea of how the vibrations will be. You expect that vibrations will be as low as the manufacturing and assembly conditions will allow. Nevertheless, when put into operation at the site, you will have the real readings of the pump's dynamics.
Something we can extract from the standard is that vibration levels are conditioned by POR and AOL definitions. Take a look a the following figure where we highlight this fact. Horizontal lines 3 and 4 represent the thresholds for POR and AOR, respectively.

Now, the standard is clear. Vibration levels for POR and AOR are defined. Vibration and POR and AOR should be in harmony. But, you and we know that this is not the case in many applications.
💡 What if we look at the same problem from the contrary perspective? What if we use the vibration levels to define POR and AOR dynamically? If vibration levels are a consequence of the pump's condition, we might well use this information and its variation to run the pumps in the head vs. flowrate curve's best possible sector.
This means that if you can plot the in-situ vibration curve and adjust it according to the pump's deterioration, you can have dynamics POR and AOR that would suggest you where you should be running your pump. We might be entering into the prescriptive maintenance realm.
Let's see how we can implement all of what was said in real life.
Our pumping application is the same presented in our article Where is my data? It consists of three centrifugal pumps set up in parallel. The characteristics of a pump in this set are:
- Horizontal split-case 750 kW @ 1800 rpm
- Designed duty point 90 m — Q: 2000 m3hhm3 @85.5% of efficiency
- BEP 78 m — Q: 2250 m3hhm3 @86.5% of efficiency. Taken from the manufacturer's information
- Handling clean water @ 35C
We will use the velocity vibration measurement from one of the pump bearings. You can use any equipment of your preference.
For study purposes, we have been collecting vibration measurements from both pump bearings for a period of 9 months. We process a moving window of 5 seconds of vibrations collection at a sampling rate of 4 kHz from VSP001 IFM accelerometers sensors. Then, the vibration RMS is sent every second to the Malibu cloud for further processing.
Let's now populate the POR and AOR charts with our real data. But first, we need to know what the vibration levels of these regions should be. For that, we turn to the ISO-10816-7 standard and select our limits. The next figure shows Table A.1 from the ISO-10816-7, where we have marked the vibration limits.

In our application, we have a great advantage. The pump's data we are about to use for this example comes from a new out of the box pump. The red rectangle in the table shows the POR and AOR vibration threshold values for a new pump. We could decide to use these values over the life of the pump. But we could also consider stretching the limits marked by the blue rectangle. Actually, the table reads: "unrestricted long-term operation in allowable operating range." Let's put it in the standard's chart.

Now, we need to find those flowrate values that make the vibration levels go over the thresholds. For that, we want you to focus on the vibration curve. This vibration curve presents a very characteristic behavior or shape. Several pump book authors have agreed with this. But, personally, or in reality, we have never seen proof of it. We will also check if my application's real vibration behaves like the previous chart's curve.
Let's start working with the data to determine how the POR and AOR change with time and how close they are to the ISO-10816-7 recommendation.
To give you an idea of the data's size, these 9 months represent about 1.54 GB, corresponding to close to 23 Million data measurements sent to the cloud. This is something that we cannot definitively process in Microsoft Excel. To process the data, we will use one of the preferred tools by scientists, the scripting software Python and the following Python libraries:
- Pandas library to handle and operate on big data, that is, cleansing, sorting, and generation of descriptive statistics, among others.
- Matplotlib library to plot the results, and
- Numpy library for numerical operations.
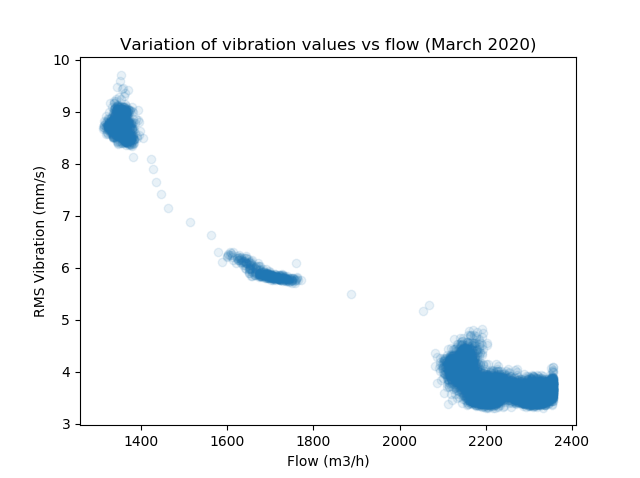
We notice that the user has decided to operate the pump closer to its BEP than to the designed duty point. Look at the accumulation of data points in the region of 2200 m³/h.
As is presented, this graph does not clearly show how the vibration behaves with respect to the flowrate. We suspect that it behaves as in the ISO standard, but to make sure, we will perform a polynomial fit for better clarifications. We can see the trend line plotted in the following graph in red.
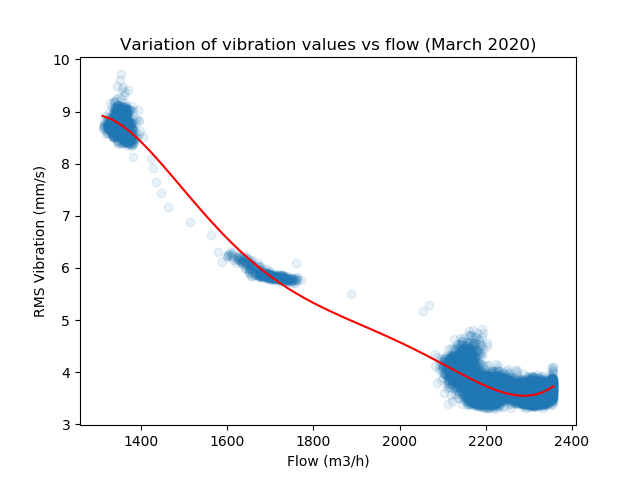
It is a matter of scaling, but it sure looks like the curve in the ISO-10816-17. As we increase the flow, vibrations tend to decrease until a point, presumably BEP, where vibrations start increasing again. Awesome!
Let's discover what is our POR and AOR for our real application.

Using the impose vibration value limits, we obtain that the POR is located between 93% - 110% of the BEP and the AOR is located between 81% - 117% of the BEP.
Let's see what happened one month later in April. Now, using for our AOR, the value 6.1 mm/s as indicated in the standard.
In April, the POR was 95%-113% of the BEP and the AOR was 82%-126% of the BEP.
We can tabulate these regions over the 9-month range to have a sense of their trend. This table could show us how the machine's condition is changing from the POR and AOR standpoint.

Values in red are estimated values using linear regression due to the lack of operational data to obtain them.
In the case of the POR, you can see how this region shrinks. According to ISO-10816-7, the acceptance region should be from 70% - 120%. In our case, it started at 88% - 110% in February when the pump was run first. If you are in charge of accepting the new pump, you could be very rigid, and base on the data presented here, you could not accept the new pump. In certain industries, this type of analysis is hardly done, and no acceptance procedure is carried out.
For the AOR case, you can see that the region does not correspond either to what the standard establishes. However, over the months, AOR maintains a little shrinking trend compared to POR, which almost disappears during the ninth month.
There are a lot of studies that we can make with just these two parameters. From our point of view, it is worth digging more into this topic. But, let's wrap this up now as it is getting too lengthy.
Summary
- We used the ISO-10816-7 standard to understand better where the pumps should be operated.
- The standard postulates that inside of POR and AOR, vibration levels should be 4.2 mm/s and 6.1 mm/s, respectively, for sustained operation conditions.
- We saw that the POR and AOR are tightly related to the pumps' life, as working outside of these ranges will speed up deterioration.
- We looked at the problem from the other way around. Instead of saying that vibration levels should be below certain limits when operating in the POR and AOR, we used vibration levels to determine POR and AOR according to vibration chart limits
- We used data from a real application, and we noticed that the initial POR for the new pump did not meet the acceptance test limits.
- We notice that POR shrinks rapidly over time, manifesting a possible deterioration or a change in process conditions that should be investigated further.
- AOR is maintained over time, giving us a clear, dynamic operating zone that could be monitored to run the pump.
- Vibration levels outside AOR were not analyzed, but they also provide useful information to set alarm limits and assess conditions.
- Finally, we used data to generate insights. Now, we it is time to take action to preserve these assets.